According to ElectroniCast, the combined use of Continuous Distributed and Point fiber optics sensors will reach $4.33 Billion in 2018…
Aptos, CA (USA) – February 14, 2014 —ElectroniCast Consultants, a leading market/technology forecast consultancy, today announced the release of their market forecast and analysis of the global consumption Fiber Optic Point Sensors and Continuous Distributed Fiber Optics Sensor systems.
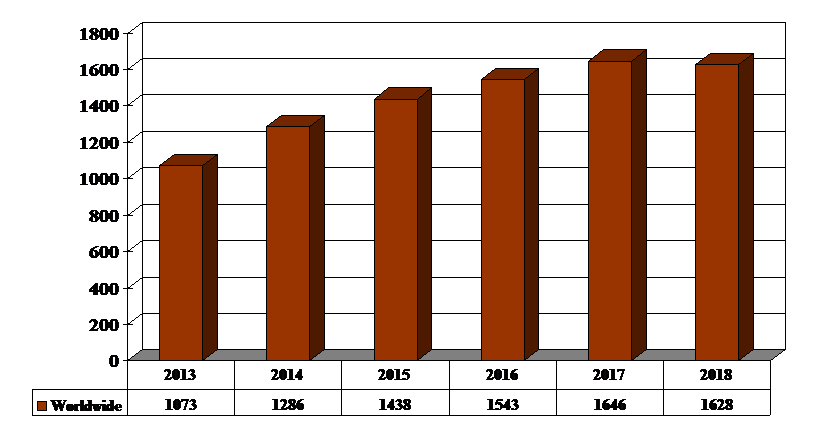
According to ElectroniCast, the consumption value is forecast to increase at an impressive 18% per year from $1.89 billion in 2013 to $4.33 billion in 2018. Market forecast data refers to consumption for a particular calendar year; therefore, this data is not cumulative data.
Continuous Distributed fiber optic sensor systems involve the optic fiber with the sensors embedded with the fiber. ElectroniCast counts each Point fiber optic sensor as one unit; however, the volume of Distributed Continuous fiber optic sensors is based on a complete optical fiber line and associated other components, which are defined as a system.
The use of Distributed Continuous fiber optic sensors in the Military/Aerospace/Security application category maintains the lead in 2014, followed by the Petrochemical/ Energy sector. The Civil Engineering/Construction sector, which includes continuous fiber sensors used in Structural Health Monitoring (SHM) as well as other concerns in buildings, bridges, tunnels, towers, and other structures, is also forecast for strong growth. Inspection and quality control frequently constitute the largest portion of production costs for many industries.
“There is a growing need for improved measurement solutions, which offer higher precision, speed and accuracy and provide better in-process measurement of moving objects, resulting in lower costs for better products. Relatively speaking, the Manufacturing/ Factory segment tends to favor point sensors instead of distributed fiber systems,” stated Stephen Montgomery, Director of the Fiber Optics Components group at ElectroniCast Consultants.
“The Biomedical/ Science sector is a relatively minor user of Distributed Continuous fiber optic sensors, in terms of consumption value, since the length of optical fiber is (very) short versus the other applications; therefore the average selling prices for the distributed continuous fiber optic sensor systems are low compared to the larger (longer length of optical fiber) distributed continuous fiber optic sensor systems used in other applications. The consumption value of Distributed Continuous fiber optic sensor systems is forecast to grow at 23% per year from $1.099 billion in 2013 to $3.096 billion in the year 2018,” Montgomery added.
DATA FIGURE
According to ElectroniCast, the consumption value of fiber optic sensors (continuous distributed systems + Point-types) will increase from $1.89 billion in 2013 to $4.33 billion in 2018.
Fiber Optic Sensor Global Consumption Market Forecast
Point vs. Distributed Continuous
(Value Basis, $Million)
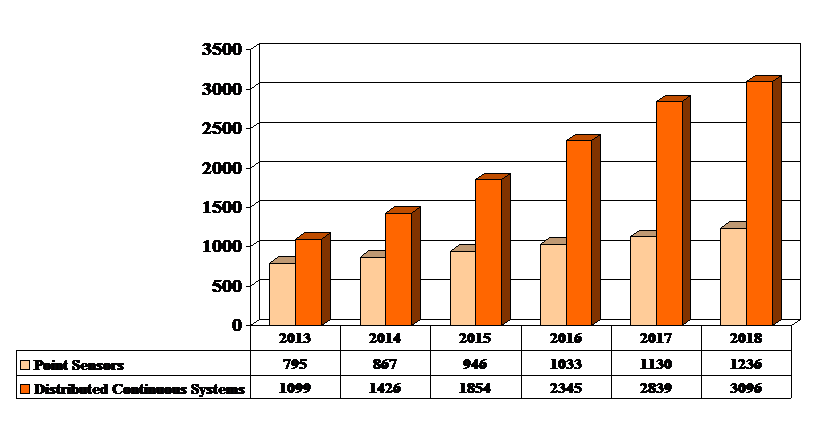
Note: Market forecast data refers to consumption for a particular calendar year; therefore, this data is not cumulative data.
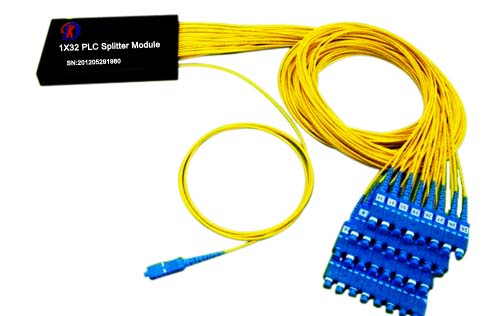
DK Photonics – www.dkphotonics.com specializes in designing and manufacturing of high quality optical passive components mainly for telecommunication, fiber sensor and fiber laser applications,such as PLC Splitter, WDM, FWDM, CWDM, DWDM, OADM,Optical Circulator, Isolator, PM Circulator, PM Isolator, Fused Coupler, Fused WDM, Collimator, Optical Switch and Polarization Maintaining Components, Pump Combiner, High power isolator, Patch Cord and all kinds of connectors.